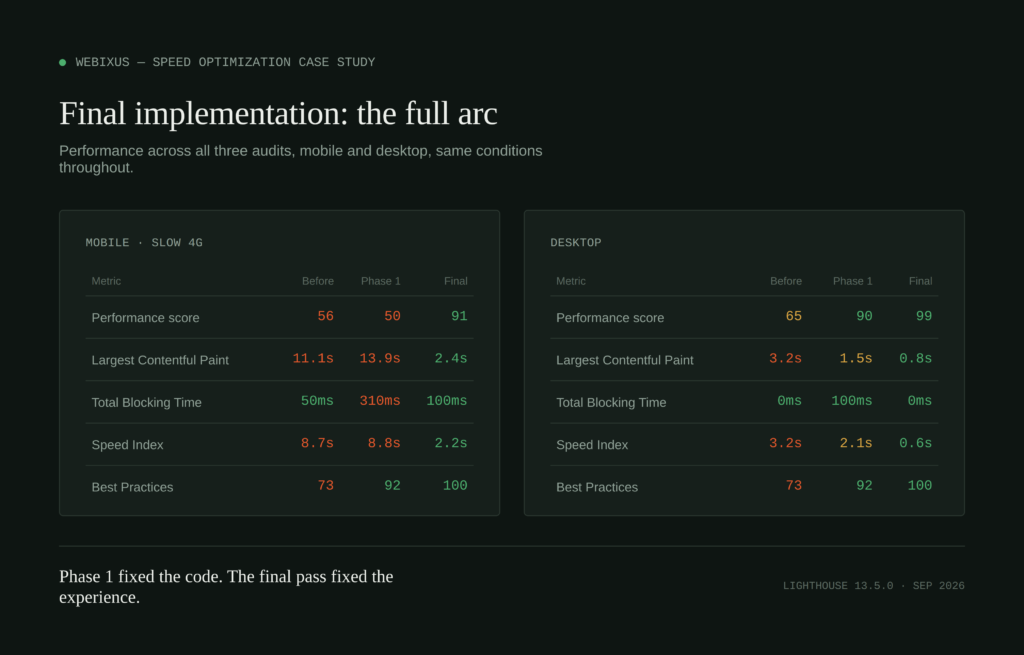
Speed Optimization taken from a red score to a green one.
A three-stage optimization pass on Webixus’s live site measured with Lighthouse under identical throttled conditions at every stage, so the numbers are directly comparable.
Before Optimization
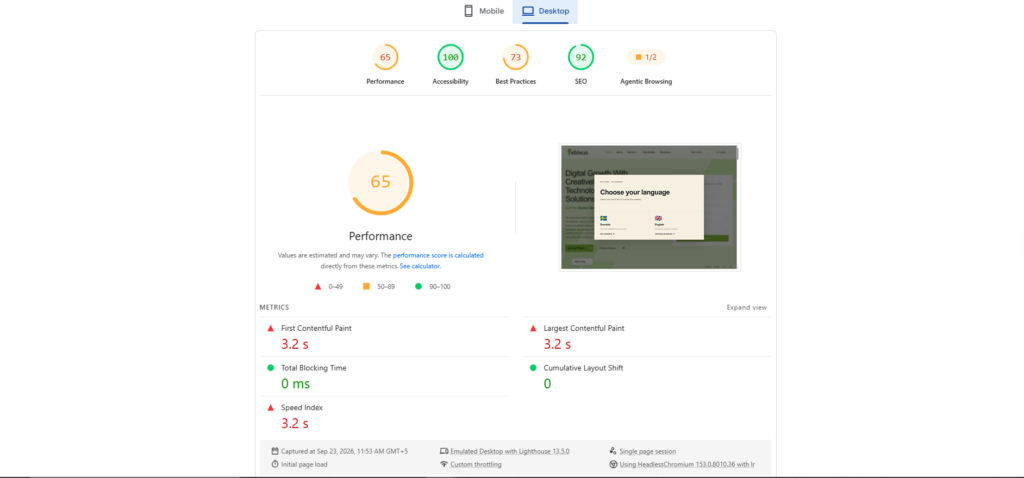
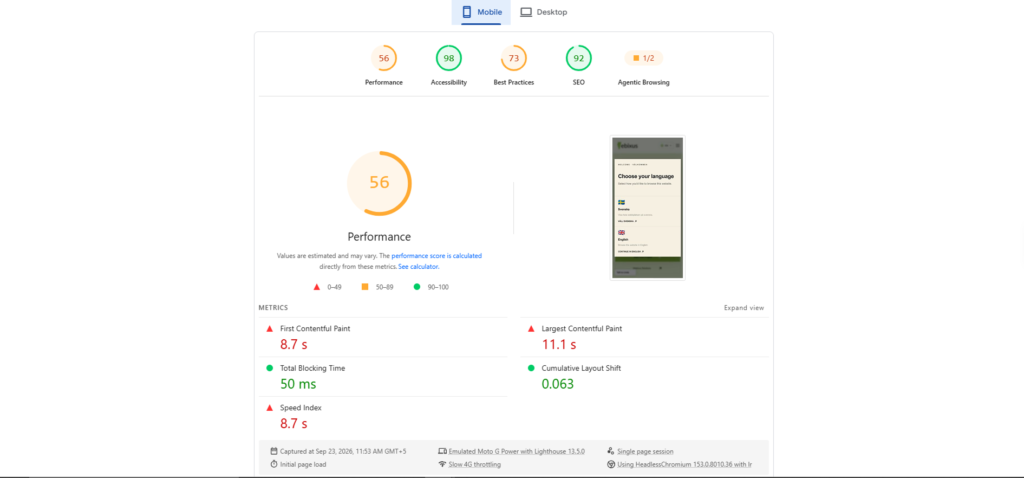
The baseline audit. Both experiences load, but mobile is the problem paint and speed index sit deep in the red, dragged down by unoptimized assets on the throttled connection.
Desktop
- First Contentful Paint: 3.2 s
- Largest Contentful Paint: 3.2 s
- Total Blocking Time: 0 ms
- Cumulative Layout Shift: 0
- Speed Index: 3.2 s
Mobile · Slow 4G
- First Contentful Paint: 8.7 s
- Largest Contentful Paint: 11.1 s
- Total Blocking Time: 50 ms
- Cumulative Layout Shift: 0.063
- Speed Index: 8.7 s
After phase -01 optimization
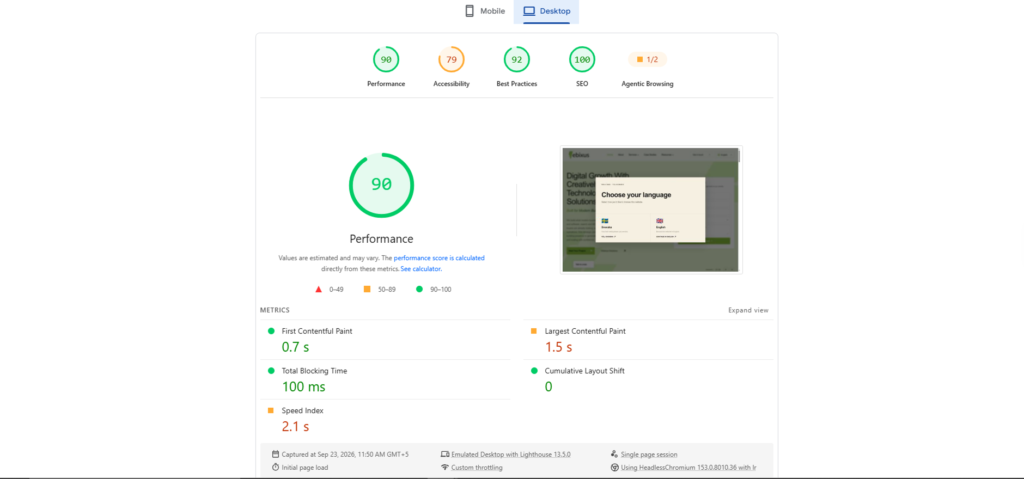
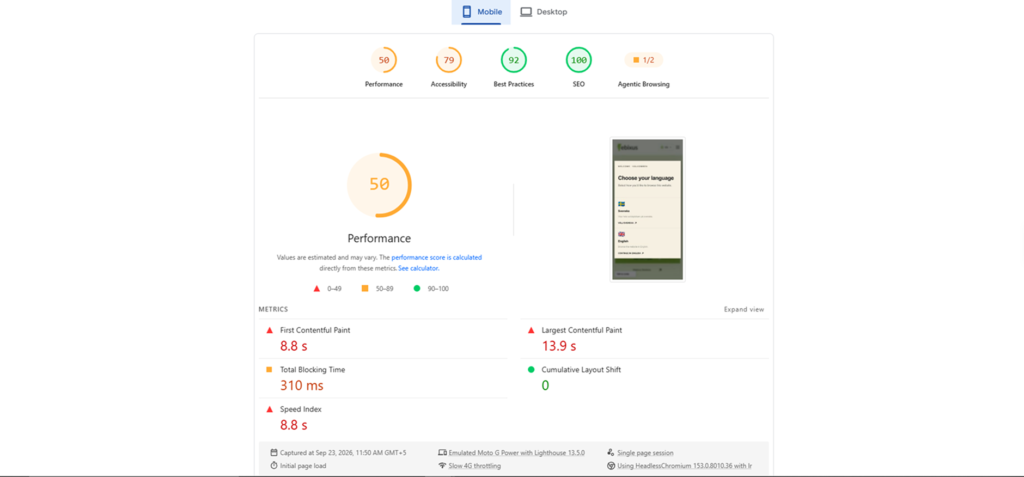
Desktop responds immediately — performance jumps to 90 as renderblocking work is cleared. Mobile tells a different story: fixing best practices and SEO surfaced a heavier main-thread cost, and blocking time spikes before it can come back down.
Desktop
- First Contentful Paint: 0.7 s
- Largest Contentful Paint: 1.5 s
- Total Blocking Time: 100 ms
- Cumulative Layout Shift: 0
- Speed Index: 2.1 s
Mobile · Slow 4G
- First Contentful Paint: 8.8 s
- Largest Contentful Paint: 13.9 s
- Total Blocking Time: 310 ms
- Cumulative Layout Shift: 0
- Speed Index: 8.8 s
Phase 02- Final implementation
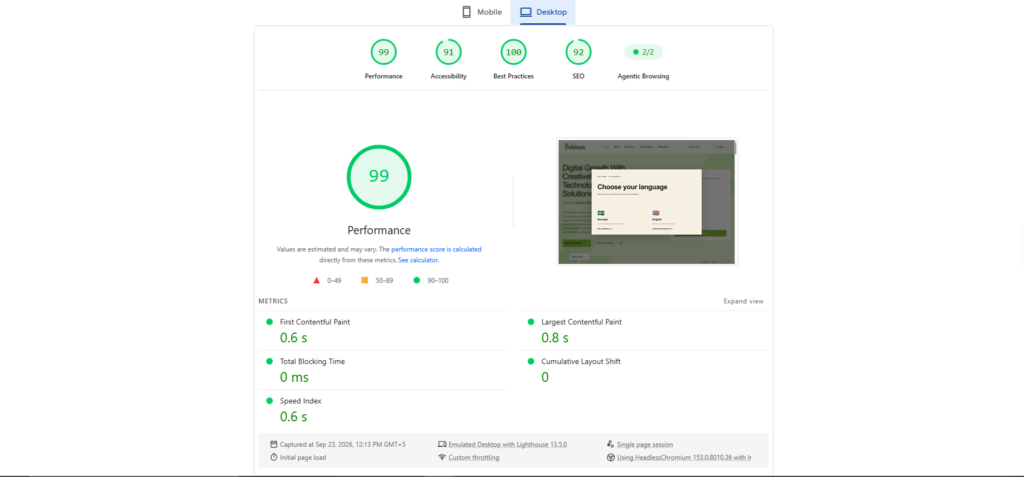
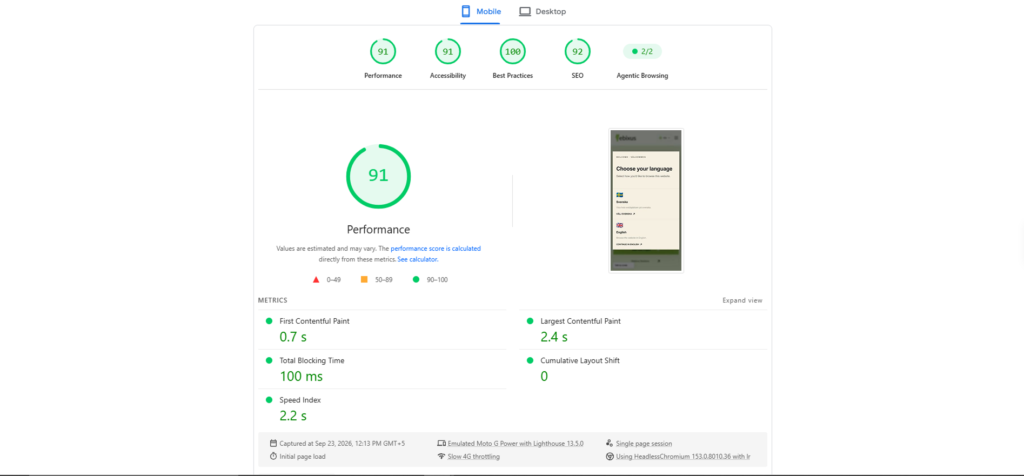
With the mobile bottleneck resolved, both experiences land in the green. Accessibility, best practices and Agentic Browsing readiness are now consistent across devices — the site performs the same regardless of how it’s measured.
Desktop
- First Contentful Paint: 0.6 s
- Largest Contentful Paint: 0.8 s
- Total Blocking Time: 0 ms
- Cumulative Layout Shift: 0
- Speed Index: 0.6 s
Mobile · Fast 5G
- First Contentful Paint: 0.7 s
- Largest Contentful Paint: 2.4 s
- Total Blocking Time: 100 ms
- Cumulative Layout Shift: 0
- Speed Index: 2.2 s